Introduction
Artificial Intelligence (AI) is everywhere these days: driving cars, composing music, writing legal briefs, and more. Some think it will revolutionize creativity, others that it’s an existential thread to mankind, or at least all our jobs.
At Bio Image we won’t write your next research paper. We’ll save you time by combining our Intelligent Quantifier-11 (IQ-11) algorithms, used by customers around the world, with a training set of your samples to speed up the most time-consuming steps in sample analysis: the detection and quantitation of bands. Our algorithms will do the other steps, too: calibrating each sample, finding its lanes, assigning the bands standards values, and reporting results. It will work with blots, too. IQ-11 is fully compliant with 21 CFR Part-11.
We look forward to saving you hundreds of hours. Maybe even more.
Let’s start by finding and quantitating bands.
1. Find and Quantitate Bands
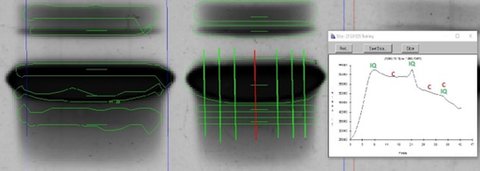
IQ-11 uses two simple parameters to detect bands: band thickness – top to bottom in a lane -- and band intensity – darkness. Many samples have bands with a wide range of thicknesses; using a “narrow band” value generally finds all of those, but often finds two bands on big dark objects. That’s what happened in the left lane above. But your training set always has one big band there, so IQ-11 will learn that, and create the one band like the right lane above. Your training set always has two bands on the shoulder below the big band. IQ-11 generally finds the lower of those two, but often not the upper one; again, it will learn to find that upper one.
Sections 4 and 5 below has a more in-depth presentation of IQ-11’s detection and quantitation algorithms.
IQ-11 uses 15 vertical cross-sections, or profiles, and 3 cross-sections on either end, to create a 36-sided outline of each band. The background-corrected darkness of each pixel inside the outline is summed up to yield the band’s quantitative volume. IQ-11 looks for inflection points in the profiles to determine the outline point. Frequently, our algorithm will result in an outline which doesn’t align with what your operators want, like the left and right bands above. So again, our AI algorithms will learn that, on a band-by-band basis.
Now we’ll back up to show the entire process from the beginning.
2. Find the Calibration Strip
This Step is Straightforward
Our first task is to find the calibration strip. If you use a Bio Image auto-calibrating scanner, we don’t need to look for the strip; acquiring the sample automatically finds it. In the image below, the thick black bar is the water-tight dam separating the sample portion of the gel tray from the calibration strip.

All Bio Image scanners come with a NIST certified and calibrated strip, which lets you make meaningful quantitative comparisons between samples.
We can find a calibration strip in other samples, too. You’ll just need to consistently place the strip in the same location.
3. Find the Lanes
This Step is Straightforward, Too
Your gel cassette gives us the number of lanes, and their approximate expected width and length. We’ll use these to create a template which we will pass over the sample from upper-left to lower-right, comparing the gray tone of the template to the image pixels. The best fit will be when the template is atop the lanes.
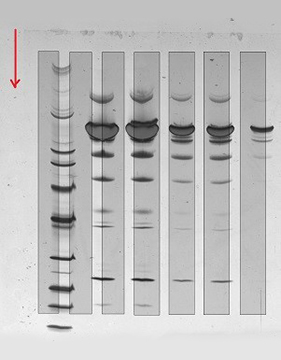
Move Down
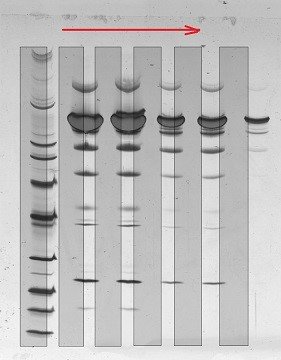
Move Across

Best Fit
4. Find the Bands
The Next Two Steps are the Hard Part, and Good Results Won’t Come Overnight
You will build up a training set of samples, on which operators have detected bands using our algorithm and then manually added and/or deleted bands.
Then we’ll incorporate any processing protocols you have; for example, which lanes might have saturated silver-stained bands, or deciding which reference or sample lanes form the basis of further calculations.
This step will likely continue for a while, as new samples are added to the training set, and potentially teach IQ-11 new tweaks to where and how it finds bands.
Our Detection Algorithm
The algorithm calculates the second derivative of each pixel on a lane’s densitometry profile. This measures change, which is what we’re looking for; and it yields a set of peaks and valleys.
All the profile between any pair of valleys is a potential band, but those must meet a darkness criterion, which is also part of our algorithm. Contact us if you’d like full explanation, complete with equations.
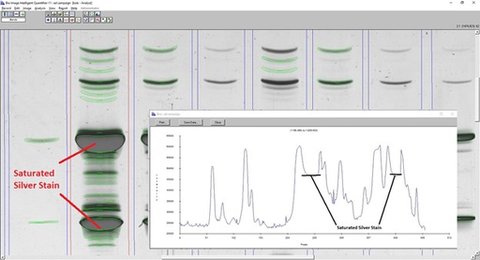
The algorithm did a pretty good, but not perfect, job. You might want some of the faint bands detected. And it definitely saw the saturated bands as two: one on the leading edge, and one on the trailing edge. When you look at the lane profile, it’s obvious why that happened.
Manual Editing
Here is where you take over: adding bands you think IQ-11 missed, and deleting those you think it shouldn’t have found. IQ-11 records all of these actions, helping it learn what lane profile characteristics necessitated manual edits. This learning process will be on display during the validation of results as new samples are put up against the training set.

The operator deleted 9 bands, and added 1. In fact, these edits combine both differences between IQ-11’s algorithm and the manual editing, but also incorporation of the sample protocol, as mentioned above. The samples have 3 Reference lanes, and 3 Sample lanes. According to the protocol, when the Reference or Study lane has saturated bands, the top 2 darkest bands are ignored in favor of the bands in the adjacent lanes.
5. Determine Band Volume
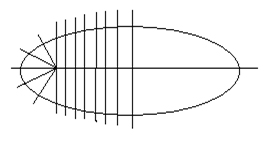
IQ automatically fits each band with a 36-sided polygon which reflects the shape or outline of the band. This polygon defines all pixels used in the quantitation of the band. Thirteen vertical cross-sections are taken between the two end-points, and five points on each end.
Like band detection, band quantitation can also be done manually: the operator marks a series of boundary points which are used in place of IQ-11’s automatically detected points. In the image below, the IQ-11 points are on the left, and the manually marked points on the right.
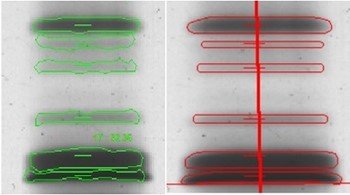
As you might expect, the operator’s points are “smoother”.
The operator sees his or her points on the edge of a band. But they really are points on one of the cross-sections, and that is how IQ-11 will combine your training set into its results. On a band-by-band basis, if necessary.
6. Calculate Standards Values – Molecular Weight, IEF, or Concentrations
We’re Back to Another Straightforward Step
Your gel cassette has specific lanes for any Mw, IEF, concentration, and or dilution standards.
So once IQ-11 locates the lanes, it knows which lanes have standards values. Below are lanes with protein dilution values. IQ-11 has some simple techniques to calculate protein µg from volume, but we can incorporate any quantitation formulae you require. The report in Section 7 shows the results of this user’s regression equations applied to their dilution bands.

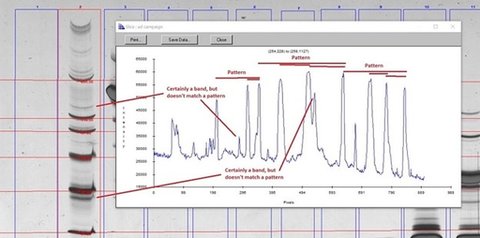
For Mw/IEF standards, the training set has identified what bands in the standards lanes have what standards value. That information gives IQ-11 a pattern to look for, as shown below. Once the standards lane bands have an Mw or IEF value, all the other bands are automatically size.
7. Report Results
This Step is Also Straightforward
IQ-11 has almost 60 different data items for every lane – for example, Total Volume of All Bands, or Band Detection Width – and over 30 data items for every band – for example, Band Area, Band Dilution, Band Mw, or Band IEF. What items, and in what order, are specified in a Report Template, letting you customize how you see the data for a sample.
But IQ-11 reports can be customized for proprietary calculations, too. This is especially helpful if you’ve been using Microsoft Excel®, have migrated to Office 365®, and want to avoid continual revalidation of your calculations every time Office 365 has an update. In the report below, the entries in red were previously done in Excel.
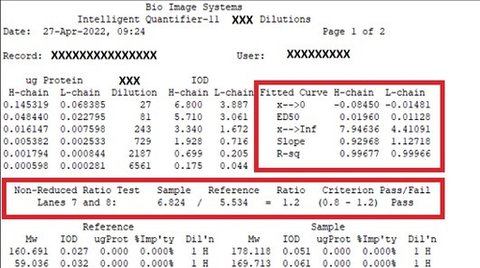
Data items containing proprietary or identifying information have been XX’d out
Summary
Together, we combined IQ-11’s proven algorithms with a training set of your samples to calibrate each sample, find its lanes, find and quantitate its bands, assign them standards values, and report results.
And saved you hundreds of hours. Maybe even more.
Gel Imaging and Analysis Software and Systems
